1
2
3
4
5
6
7
8
9
10
11
12
13
14
15
16
17
|
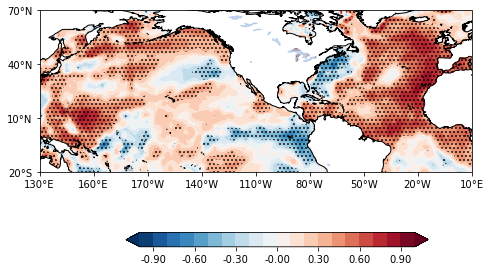
fig = plt.figure(figsize=(12,8))
f_ax1 = fig3.add_axes([0.1, 0.1, 0.5, 0.5],projection = proj)
leftlon, rightlon, lowerlat, upperlat = (130,360,-20,70)
img_extent = [leftlon, rightlon, lowerlat, upperlat]
contour_map(f3_ax1,img_extent,30,30)
cf1 = f_ax1.contourf(lon,lat,r, zorder=0, levels =np.arange(-1,1.1,0.1) , extend = 'both',transform=ccrs.PlateCarree(), cmap=plt.cm.RdBu_r)
cf2 = f_ax1.contourf(lon,lat, p, [0,0.05,1] ,
zorder=1,hatches=['...', None],colors="none", transform=ccrs.PlateCarree())
position=fig3.add_axes([0.2, 0.08, 0.35, 0.025])
fig3.colorbar(cf1,cax=position,orientation='horizontal',format='%.2f',)
plt.show()
|

