1
2
3
4
5
6
7
8
9
10
11
12
13
14
15
16
17
18
19
20
21
22
| import matplotlib.pyplot as plt
import numpy as np
x = np.arange(-5, 5, 0.5)
y1 = -5*x*x + x + 10
y2 = 5*x*x + x
fig = plt.figure(figsize=(15,5))
ax1 = fig.add_subplot(1,2,1)
ax1.plot(x, y1, x, y2, color='black')
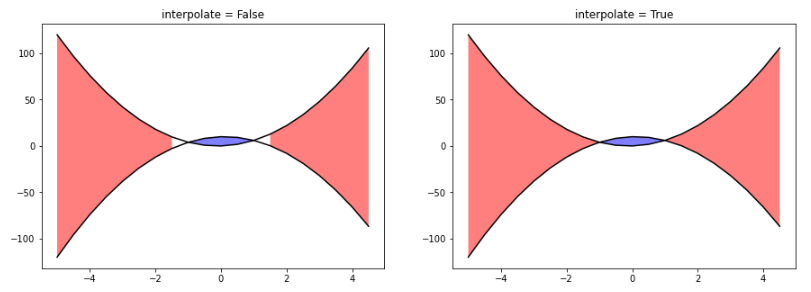
ax1.fill_between(x, y1, y2, where=(y2 > y1), facecolor='red', alpha=0.5)
ax1.fill_between(x, y1, y2, where=(y2 <= y1), facecolor='blue', alpha=0.5)
ax1.set_title('interpolate = False')
ax2 = fig.add_subplot(1,2,2)
ax2.plot(x, y1, x, y2, color='black')
ax2.fill_between(x, y1, y2, where=(y2 > y1), facecolor='red', alpha=0.5,interpolate=True)
ax2.fill_between(x, y1, y2, where=(y2 <= y1), facecolor='blue', alpha=0.5,interpolate=True)
ax2.set_title('interpolate = True')
plt.show()
|
