1
2
3
4
5
6
7
8
9
10
11
12
13
14
15
16
17
18
| import matplotlib.pyplot as plt
import numpy as np
ao = pd.read_csv("AO.txt",sep='\s+',header=None, names=['year','month','AO'])
ao_jan = ao[ao.month==1]
ao_feb = ao[ao.month==2]
fig = plt.figure()
ax1 = fig.add_subplot(1,1,1)
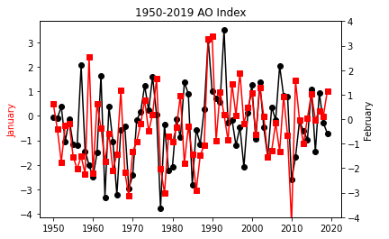
ax1.plot(np.arange(1950,2020,1),ao_jan.AO,'ko-',label='Jan')
ax1.set_ylabel('January',c='r')
ax1.set_title('1950-2019 AO Index')
ax2 = ax1.twinx()
ax2.plot(np.arange(1950,2020,1),ao_feb.AO,'rs-',label='Feb')
ax2.set_ylim(-4,4)
ax2.set_ylabel('February',c='k')
|

