一、单变量折线图
1 | import pandas as pd |
输出图形如下:
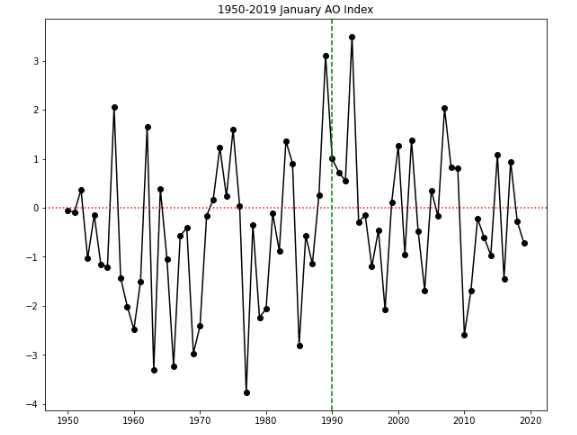
其中数据格式如下:
1 | print(ao) |
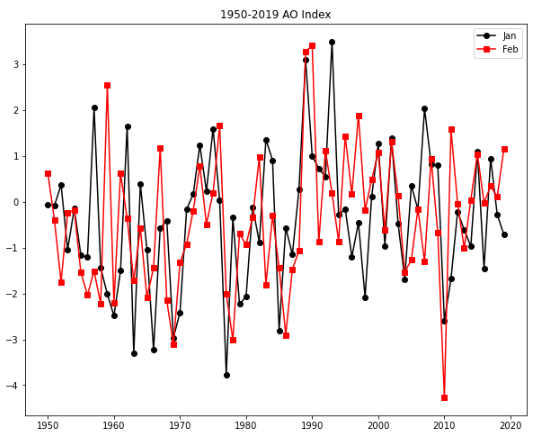
二、多变量折线图
实际上只是在同一个axes下叠加多个axes.plot()图层
1 | import pandas as pd |
测试数据下载地址:点此下载
一、单变量折线图
1 | import pandas as pd |
输出图形如下:
其中数据格式如下:
1 | print(ao) |
二、多变量折线图
实际上只是在同一个axes下叠加多个axes.plot()图层
1 | import pandas as pd |
测试数据下载地址:点此下载