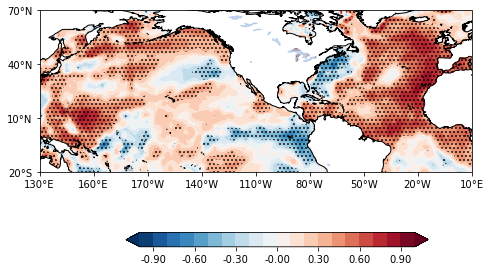
1
2
3
4
5
6
7
8
9
10
11
12
13
14
15
16
17
18
19
20
21
22
23
24
25
26
27
28
29
30
31
32
33
| import cartopy.crs as ccrs
import cartopy.feature as cfeature
import matplotlib.pyplot as plt
import cartopy.mpl.ticker as cticker
proj = ccrs.PlateCarree(central_longitude=245)
fig = plt.figure(figsize=(12,8))
fig_ax1 = fig.add_axes([0.1, 0.1, 0.5, 0.5],projection = proj)
leftlon, rightlon, lowerlat, upperlat = (130,360,-20,70)
img_extent = [leftlon, rightlon, lowerlat, upperlat]
fig_ax1.set_extent(img_extent, crs=ccrs.PlateCarree())
fig_ax1.add_feature(cfeature.COASTLINE.with_scale('50m'))
fig_ax1.add_feature(cfeature.LAKES, alpha=0.5)
fig_ax1.set_xticks(np.arange(leftlon,rightlon+30,30), crs=ccrs.PlateCarree())
fig_ax1.set_yticks(np.arange(lowerlat,upperlat+30,30), crs=ccrs.PlateCarree())
lon_formatter = cticker.LongitudeFormatter()
lat_formatter = cticker.LatitudeFormatter()
fig_ax1.xaxis.set_major_formatter(lon_formatter)
fig_ax1.yaxis.set_major_formatter(lat_formatter)
cf1 = fig_ax1.contourf(lon,lat,r, zorder=0, levels =np.arange(-1,1.1,0.1) , extend = 'both',transform=ccrs.PlateCarree(), cmap=plt.cm.RdBu_r)
cf2 = fig_ax1.contourf(lon,lat, p, [0,0.05,1] ,
zorder=1,hatches=['...', None],colors="none", transform=ccrs.PlateCarree())
position=fig3.add_axes([0.1, 0.08, 0.35, 0.025])
fig3.colorbar(cf1,cax=position,orientation='horizontal',format='%.2f',)
plt.show()
|

