同样使用折线图示例中使用过的数据
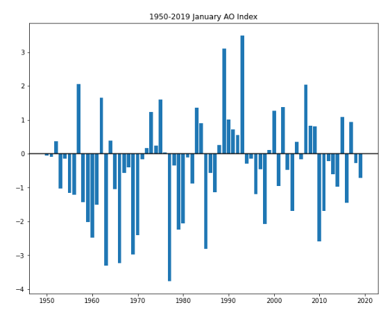
最基础的柱状图绘制如下:
1
2
3
4
5
6
7
8
9
10
11
12
13
14
| import pandas as pd
import matplotlib.pyplot as plt
ao = pd.read_csv("AO.txt",sep='\s+',header=None, names=['year','month','AO'])
ao_jan = ao[ao.month==1]
fig = plt.figure(figsize=(10, 8))
ax1 = fig.add_subplot(1,1,1)
ax1.set_title('1950-2019 January AO Index')
ax1.bar(np.arange(1950,2020,1),ao_jan.AO)
ax1.axhline(0,c='k')
plt.show()
|
输出图形如下:

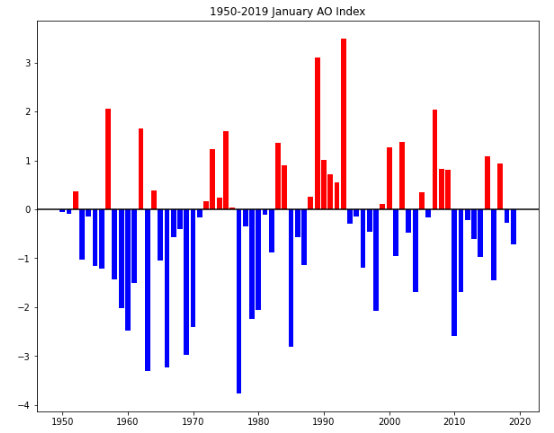
为了更鲜明的区分正值和负值,我们常将正负值的bar设置为不同颜色,方法如下:
1
2
3
4
5
6
7
8
9
10
11
12
13
14
15
16
17
18
| import pandas as pd
import matplotlib.pyplot as plt
ao = pd.read_csv("AO.txt",sep='\s+',header=None, names=['year','month','AO'])
ao_jan = ao[ao.month==1]
colors = np.zeros(ao_jan.AO.shape,dtype=np.str)
colors[ao_jan.AO>=0] = 'red'
colors[ao_jan.AO<0] = 'blue'
fig = plt.figure(figsize=(10, 8))
ax1 = fig.add_subplot(1,1,1)
ax1.set_title('1950-2019 January AO Index')
ax1.bar(np.arange(1950,2020,1),ao_jan.AO,color=colors)
ax1.axhline(0,c='k')
plt.show()
|
输出图形如下:


