线性倾向估计(一元线性回归)

除1.132节介绍的的线性回归系数可用来计算线性回归外,sklearn库中也有相关的函数用来计算一元线性回归,同时还可以输出回归线,为数据可视化提供了便利。

1
2
from sklearn.linear_model import LinearRegression
LinearRegression(fit_intercept=True, normalize=False, copy_X=True)

参数:

fit_intercept :是否计算截距,若数据已中心化,则可以不计算。默认True。

normalize :若开启,则对数据进行归一化处理。

copy_X :若开启,则复制X,否则对X进行重写覆盖。

属性:

coef_ :线性回归系数

intercept_ : 截距

方法:

fit(x,y) :建立x,y的回归模型

predict(x) :利用回归模型进行预测

score(x, y[, sample_weight]) :返回R^2

1
2
3
4
5
6
7
8
9
10
11
12
13
14
15
16
from sklearn.linear_model import LinearRegression
import matplotlib.pyplot as plt
import numpy as np
#建立数据
x = np.arange(2000,2011,1).reshape(-1, 1)
y = np.array([3.9, 4.4, 10.8, 10.3, 11.2, 13.1, 14.1, 9.9, 13.9, 15.1, 12.5]).reshape(-1,1)
#创建回归模型
solver = LinearRegression()
#对x,y进行回归计算
solver.fit(x,y)
#计算x对应的回归值
regressline = solver.predict(x)
#绘图
plt.scatter(x,y)
plt.plot(x, regressline, color='k',linewidth=3)
plt.show()

image-20200519214110927

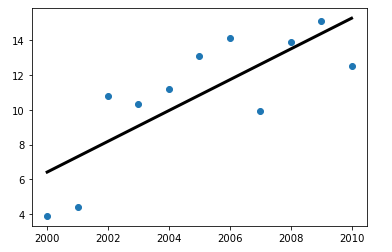
该方法较1.132节相对繁琐,甚至有些小题大做。因为该方法主要用于通过已有数据建立回归模型,对未知数据进行一元回归预测,在机器学习中使用更为广泛,在此处,仅仅体现了较为方便的回归线的绘制。